A nicely looking report is actually very easy to make.
When you have a good idea for a program, you first focus on solving a problem. Visualization is usually a lower priority.
At this point, it’s worth considering whether it’s really necessary to create code for visualization. Personally, I favor existing technical solutions, so I can focus on solving actual problems.
In this post, I would like to focus on what I believe is a basic tool for visualization – HTML.
The idea is simple: we use any programming language to solve the problem, and we save the HTML file as the output of the program. That file can be opened in any web browser.
Example
Let’s write a script that calculates the size of all directories located in the current location.
First, let’s get to know the tool that we are going to use: du
du -sh *It will output the accumulated sizes of all directories relative to our current location. For example:
7.1M	books
31M	photos
501M	videos
Let’s use this tool in the table formatting script:
#!/bin/bash

printf "| %10s | %10s |\\n" "Name" "Size"
printf "| ---------- | ---------- |\\n"

du -sh * | while read -r line ; do
    size="$(echo $line | cut -d ' ' -f 1)"
    name="$(echo $line | cut -d ' ' -f 2)"
    printf "| %10s | %10s |\\n" "${name}" "${size}"
done
Now let’s see how to create an HTML file using almost the same script:
#!/bin/bash

printf '<body><table border="1"><tr><th>%s</th><th>%s</th></tr>' "Name" "Size"

du -sh * | while read -r line ; do
    size="$(echo $line | cut -d ' ' -f 1)"
    name="$(echo $line | cut -d ' ' -f 2)"
    printf "<tr><td>%s</td><td>%s</td></tr>" "${name}" "${size}"
done
printf "</table></body>"
We can run it and redirect output to the file:
./test.sh > test.htmlNow, we can open this file using a web browser. We should see a page that looks like this:
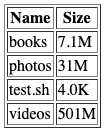
This is a very simple HTML file, but most web browsers can work with it. It has no head section, which is needed for actual websites, and it does not interact with any server. This lack of interaction is the reason we call it static HTML.
We can save this file to the disk and open it whenever we want. We can also put it into a cloud storage service and view it on a smartphone. In this way, we can have programs run on our computer and take the output with us on mobile devices.
Real life example
This exact technique is used by Windows to generate a battery report. See the steps outlined in this manual: How to Generate Battery Report Using the POWERCFG Command.
This Windows program does exactly what we just did — it processes information and generates a report that we can view in a web browser.
Further reading
HTML is just the beginning. It is probably the most accessible format, as everyone has a browser. This method opens up a lot of possibilities, because you don’t have to use any graphics library to present data nicely. Of course, the resulting page will not be interactive, but in many cases this is not a problem.
There are also libraries for creating HTML and I recommend using them, but as you can see in the example, you can work without them.
The technique of creating a text file and using another program to display it, can also be applied to other technologies:
- KML or GPX files and Google Earth.
- Markdown, Tex and other files and programs that generate PDF files from them.
- Textual description of diagrams and conversion to graphic files using tools like PlantUML, or graphviz.

You must be logged in to post a comment.